


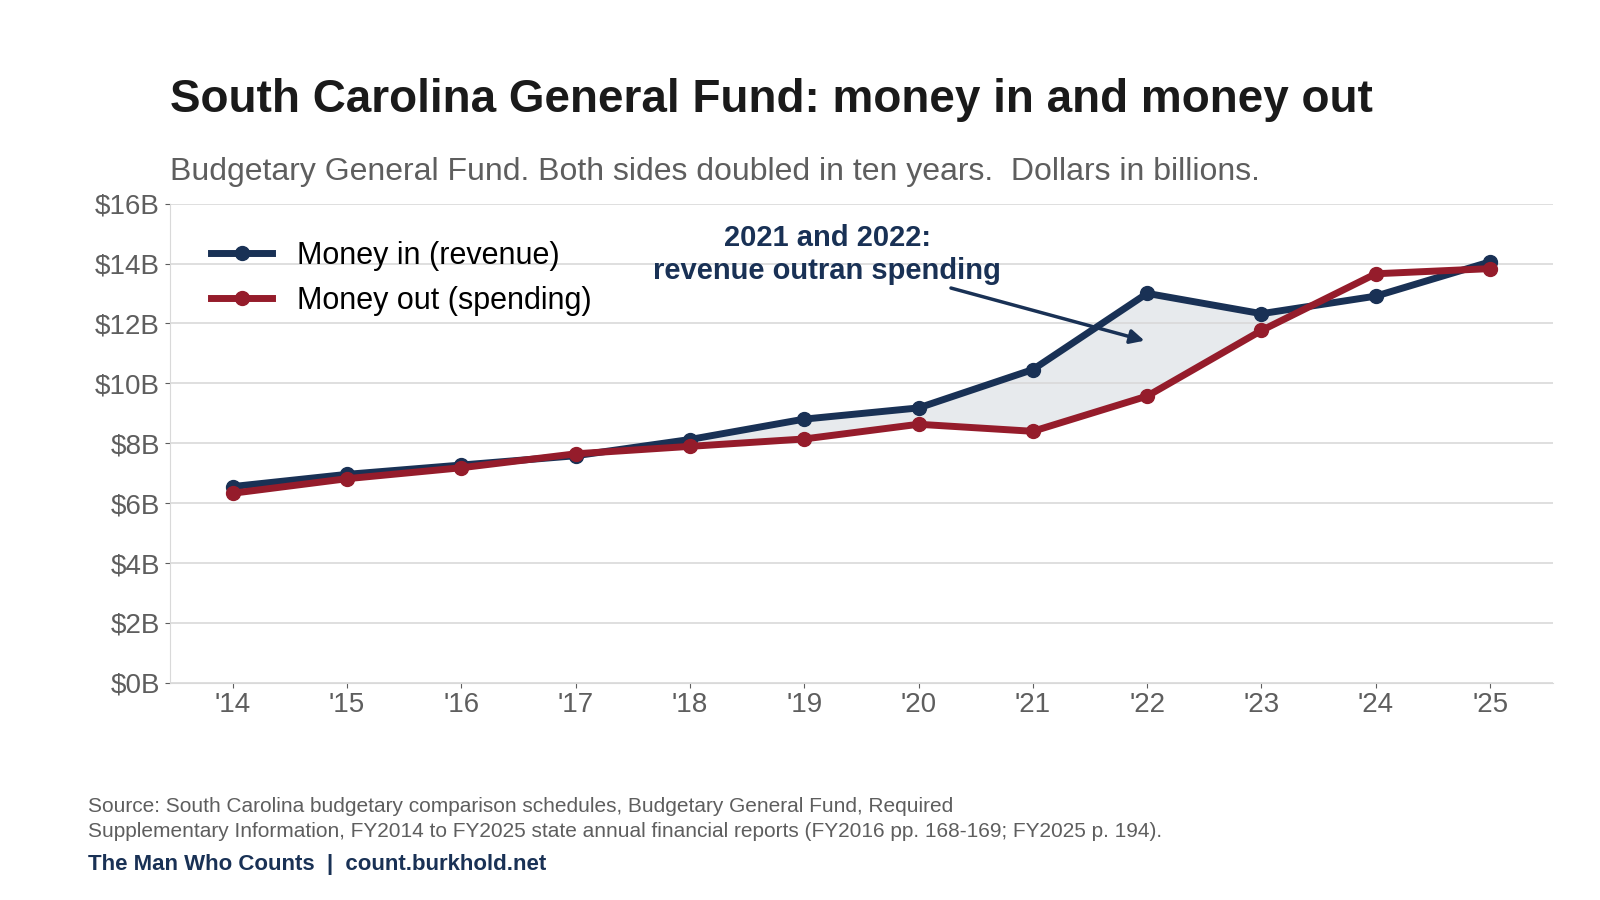
Ten years ago South Carolina spent $6.8 billion on its operating budget. Last year it spent $13.8 billion.1
The first question anyone should ask is whether it had to happen. Some of it did.
About 674,000 more people live here now than lived here in 2015. Every one of them is a new driver on a road, a new patient in a clinic, sometimes a new child in a classroom. Prices went up too, about 35 percent, so the same textbook and the same mile of asphalt cost about a third more than they used to.2 The count has to allow for more people to serve and more expensive everything to serve them with.
The new people and the higher prices together should have grown the budget by about half, to roughly $10.5 billion. That is what keeping up with population growth and inflation would have cost.
The state spent $13.8 billion. The difference is a little over $3 billion. Not once. Every year.3
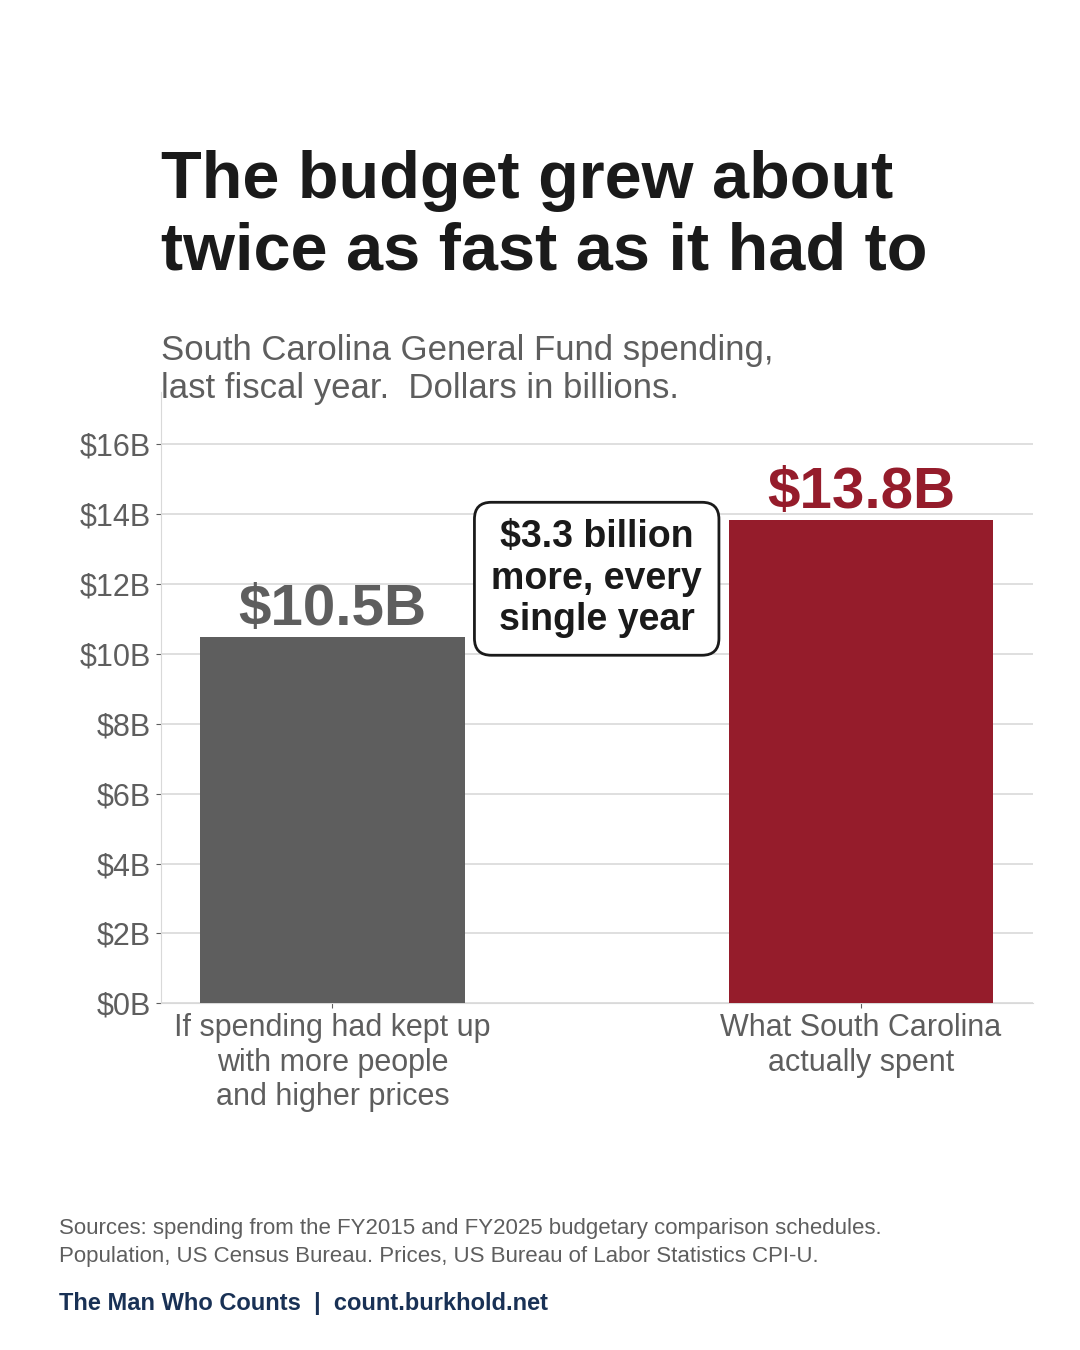
So spending $3 billion more a year is not required by inflation and population growth. It is a choice. And the question any family would ask is simple. What did we get for spending all this additional money? It might have been good news: new programs, more bridges repaired, more miles of road paved.
The state does not publish what we got for all this extra spending, so we can’t know.
The state’s annual financial report says how much each agency received. It does not say what the agency delivered for the money. Ask what the extra $3 billion a year produced and there is no page to turn to.
You would expect a state spending at that pace to be scraping the bottom of the account by the end of the budget year in June. It is not. Last year the state took in about $227 million more than it spent, near enough to breaking even on a budget that size. But the account the $227 million surplus went into finished the year holding $6.6 billion, built up over years and carried forward one year into the next. Ten years earlier that same account held $1.2 billion.4
The individual income tax, every dollar the state collected last year from every working person in South Carolina, came to $5.9 billion.5
The state is sitting on more money than it takes out of our paychecks in a year.
It is not thrift. Spending went up in nine of the last ten years. It went up faster than population growth and prices.6 The money came from two years.
In 2021 and 2022, revenue ran ahead of spending by about $5.5 billion combined. That was the pandemic, though not the way most people would guess. The federal relief money went into separate accounts (we will cover at a later date), on different pages of the same report. What landed on the state’s own books was ordinary state tax, because federal stimulus checks got spent at South Carolina stores and taxed on the way through. Sales tax collections rose about 38 percent in three years.7
In February 2022, with the money coming in, the state’s own economists reported that revenue had grown 22.5% in a year. They said the sales tax and corporate tax share of it was temporary. They used the word “bubble.”8 Those two years built the pile of money, and the years since have run roughly even between them. Running even sounds responsible, and a pile of money can look like careful saving. But the state already keeps real savings accounts. The law requires two of them, and both are filled to the line the law requires. A third sits beside them with no formula cap. All three together come to about $1.4 billion, and all three are inside the $6.6 billion. The other $5.2 billion is not savings anyone planned. It came in too fast, got stacked, and has stayed in the system.9
Two years ran the other way. In 2017 the state spent about $63 million more than it collected, and the books closed in the black only because a lawsuit settlement put $139 million in the account. That is money from a courtroom, not from taxes. In 2024 spending ran about $748 million ahead of revenue and the balance fell by more than $800 million, the steepest drop in the whole run.10
When a raise comes, one of two things usually happens in a house. Either it goes into the account and stays there, or the house grows into it, and a year later there is a bigger payment and no clear sense of where the money went. Columbia managed both. Spending grew into the raise, all of it, and the account filled up anyway.
Nobody minds paying their share. You pay it the way you pay the light bill, because the lights have to stay on. What is not settled is whether anyone was ever going to tell you that the money came in faster than the state could spend it, that the state spent more anyway, and that what is left is sitting there. Somebody in Columbia is supposed to be keeping those books and saying so out loud. That is what I’ll do when I’m elected Comptroller General.
The file behind this piece was built by the campaign’s volunteer research team. The work in this series is theirs as much as mine.
Next week: The Pile of Money. Of the $6.6 billion, $3.4 billion is money the budget lets agencies keep past June 30, year after year.
Last week:
Announced

Every January, South Carolina posts its scoreboard for the year in economic development, and the numbers arrive with decimal precision. The latest: $9.12 billion in capital investment, 82 projects, more than 8,100 new jobs, the third-highest year on record. Read the state’s own sentences, though, and one word rides in front of nearly every figure. “Anno…
Budgetary General Fund expenditures: $6,814,972,000 in FY2015 and $13,830,789,000 in FY2025, an increase of 102.9 percent. From the Budgetary Comparison Schedule (Non-GAAP Budgetary Basis), Budgetary General Fund, in the state’s Annual Comprehensive Financial Report, page 194 of the FY2025 edition and page 158 of the FY2015 edition. Revenues did the same thing, rising from $6,960,389,000 to $14,057,744,000, or 102.0 percent. The schedules print their figures in thousands, so on the page these appear with the last three zeros dropped: 6,814,972 and 13,830,789.
This is the operating budget the General Assembly votes on every June. The state counts the General Fund a second way in the same report, under accounting rules that sweep in money the budget handles separately, and that version is larger: $20,731,521,000 in revenue on page 48. Both are correct. Most of the difference is money set aside by law before it ever reaches the budget the legislature writes, not the same money counted at a different moment. This piece uses the budget version throughout, because that is the one the legislature votes on and the one the balance sits in. The state’s own summary does the same, on pages 33 and 34.
Total state spending, counting federal funds and everything earmarked, is roughly three times the operating budget. Nothing here is a claim about that larger figure.
Population: 4,896,006 on July 1, 2015 and 5,570,274 on July 1, 2025, an increase of 674,268, or 13.8 percent. US Census Bureau; the 2015 figure from the intercensal estimates for 2010 to 2020 via the South Carolina Revenue and Fiscal Affairs Office State Data Center, the 2025 figure from the Vintage 2025 state estimates released January 27, 2026. Prices: the Consumer Price Index for All Urban Consumers, all items, US city average, not seasonally adjusted, rose from 238.638 in June 2015 to 322.561 in June 2025, an increase of 35.2 percent. Bureau of Labor Statistics releases of July 17, 2015 and July 15, 2025. The BLS South region series, which includes South Carolina, rose slightly less, 34.6 percent, so using it would make the state's growth look marginally worse rather than better. No South Carolina price index is published.
More people and higher prices together account for growth of 53.8 percent: 1.1377 multiplied by 1.3517. Applied to FY2015 spending of $6,814,972,000, a budget that kept pace would have spent $10.48 billion in FY2025. Actual spending was $13.83 billion, a difference of $3.35 billion. Put another way, after accounting for every new arrival and every dollar of inflation, the state spends about a third more per resident than it did ten years ago.
FY2025 revenues exceeded expenditures by $226,955,000, page 194. The ending balance after reservation was $6,604,224,000, stated on page 194 and again on page 34. The FY2015 balance after reservation was $1,193,825,000, page 159 of that year's report. This balance is an accumulated total carried forward year to year, not a single year's surplus, and it is not at its peak: it reached $6,865,938,000 in FY2022. The account this piece describes is that balance as the state reports it, one line of the schedule, not a single bank account.
Individual income tax, actual collections, FY2025: $5,921,372,000. Same schedule, page 194. Retail sales and use tax was $5,027,613,000 and corporation income tax $1,321,629,000 on the same page.
Budgetary General Fund expenditures rose year over year in nine of the ten changes between FY2015 and FY2025. The exception is FY2021, when spending fell about $235 million from FY2020.
FY2021 revenues exceeded expenditures by $2,061,737,000 and FY2022 by $3,431,550,000, a combined $5,493,287,000. Same schedule in each year’s report.
Federal money does not appear in the Budgetary General Fund. It sits in Other Budgeted Funds, a separate schedule in the same report. Federal revenue there rose from $7,503,011,000 in FY2019 to $13,904,263,000 in FY2022, and that fund’s own ending balance rose from $5,735,341,000 to $9,241,850,000 in FY2022 alone. None of it is part of the $6.6 billion this piece is about.
What did rise in the General Fund was state tax. Sales and use tax collections went from $3,186,425,000 in FY2019 to $4,401,993,000 in FY2022, an increase of 38.1 percent. Individual income tax went from $4,160,604,000 to $6,221,166,000, an increase of 49.5 percent. Those two lines account for roughly three quarters of the entire revenue increase over that stretch. FY2019 figures from page 184 of that year’s report; FY2022 from page 184 of that year’s.
"The state's own economists" are the South Carolina Board of Economic Advisors. Press release of February 15, 2022, "The BEA Revises FY 2021-22 and FY 2022-23 Forecasts Upward." The release states that revenue had grown 22.5 percent over the preceding twelve months, that growth in the three major tax categories was creating a bubble in revenue collections, and that stimulus spending and changed consumer behavior had produced temporary revenue growth in sales and corporate income tax that was not expected to continue into the following fiscal year. The same release judged the individual income tax growth more durable, because it was driven by wage increases that typically hold. Published by the Revenue and Fiscal Affairs Office.
The composition of the $6,604,224,000 balance, from page 9 of the transmittal letter in the FY2025 report: legislatively approved agency carryover appropriations of $3.426 billion, the Contingency Reserve of $332,294,000, the General Reserve of $739,568,000, the Capital Reserve of $369,784,000, and an unassigned surplus of $1.736 billion. The reserve rules are on page 8: the General Reserve is required at 5 percent of General Fund revenues for the latest completed fiscal year, raised by a 2022 voter referendum to 7 percent in half-percent annual steps starting in fiscal 2024, making the 2025 requirement 6 percent; the Capital Reserve is required at 2 percent, raised to 3 percent starting in fiscal 2024. Both match their formulas against fiscal 2023 revenues of $12,326,129,000 to the thousand: 6 percent is $739,568,000 and 3 percent is $369,784,000. The Contingency Reserve has no required level. The three reserves total $1,441,646,000; the balance minus the three reserves is $5,162,578,000.
FY2017: revenues of $7,582,470,000 against expenditures of $7,645,520,000, a shortfall of $63,050,000, with $139,260,000 transferred in from the Litigation Settlement Account. FY2024: revenues of $12,911,738,000 against expenditures of $13,659,399,000, a shortfall of $747,661,000; the ending balance after reservation fell from $6,845,879,000 to $6,019,850,000, a decline of $826,029,000, the largest in the banked series.
Thank you, sir. My question is whether the added spending brought on by migration into our state from other states is actually covered by the increase in revenue. Years ago when my sister moved to Arizona, new residents paid $400 for an AZ driver’s license; this at a time when AZ was one of the fastest growing states in population. Whether it balanced the state’s budget or not, I have no clue. But as we are all impacted by surging development I hope these new neighbors are bearing their share of expanding our infrastructure…